Bay Area Home Value Appreciation Rates
since 2011 (the post-crash bottom of the market)
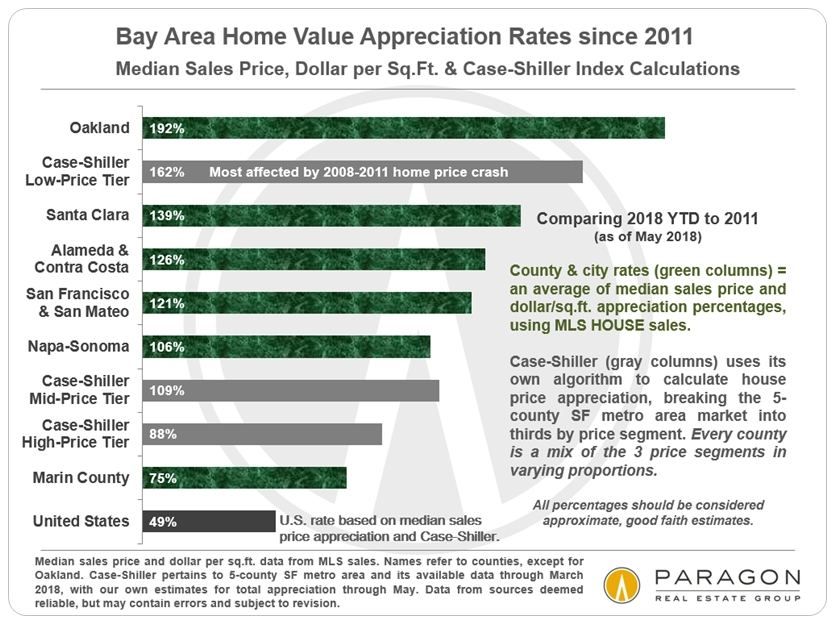
The county and city appreciation percentages in the chart above were calculated by averaging changes in both median sales prices and average dollar per square foot values. We also incorporated S&P Case-Shiller San Francisco metro area calculations based upon its algorithm breaking the market into thirds by price segment. Each city and county includes within itself a wide variety of individual real estate markets of different price segments and varying dynamics, so these percentages are broad generalities. It is impossible to know how they apply to any particular home without a specific comparative market analysis.
IMPORTANT NOTE: As with stock market (or bitcoin) performance, comparative appreciation rates in housing markets vary wildly depending on the exact start and end dates of the analysis.
Bay Area Median Home Price Trends
since 1990
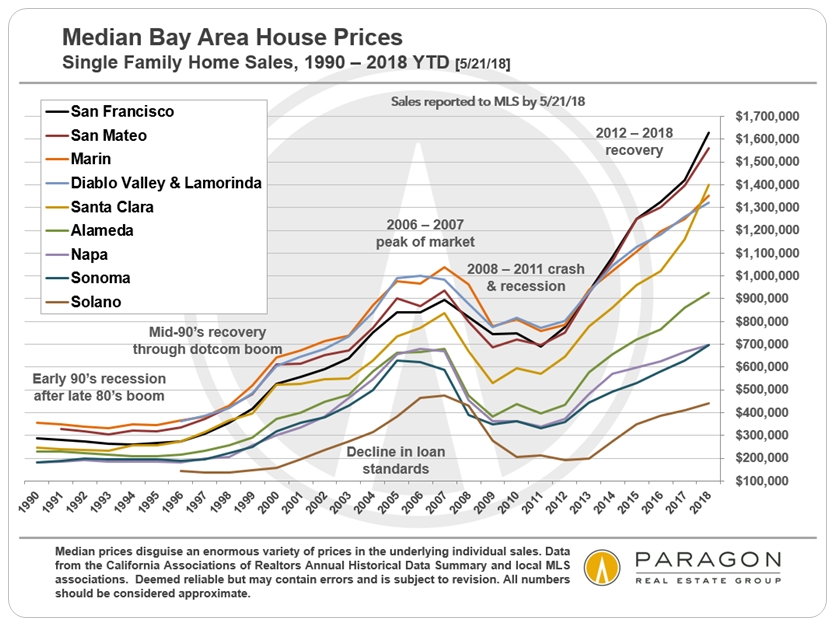
Major Factors in Bay Area Appreciation
The appreciation rate and market dynamics of each individual Bay Area market since 2011 has each been affected by a mix of different factors - to greater or lesser degrees:
1) Being at the center of the high-tech boom (San Francisco, San Mateo, Santa Clara); 2)
proximity to the central counties, but with significantly lower housing costs (Alameda County and especially Oakland are prime examples): 3) being affected to an outsized degree by subprime financing and the 2008-2011 distressed-property price crash (Oakland and many outlying, less expensive areas); 4) relative affordability: in recent years, as home prices soared, the highest pressure of buyer demand moved to less costly markets within and between counties; 5) substantially increased supply due to new construction (San Francisco condo market); 6) increases in the average size of homes sold (+13% in San Francisco); and 6) the general national economic recovery: U.S. home prices have appreciated by about 49% since hitting bottom in 2011.
Generally speaking, the most affluent neighborhoods, with the most expensive homes, have appreciated less on a percentage basis (but more on a dollar-increase basis) than more affordable neighborhoods - especially over the past 2-3 years. This dynamic also occurred in the latter period of the last housing boom.
There were sometimes specific local factors, such as the terrible fires in Sonoma, or the opening of the new Apple spaceship headquarters, which played roles in boosting home prices in their locales.
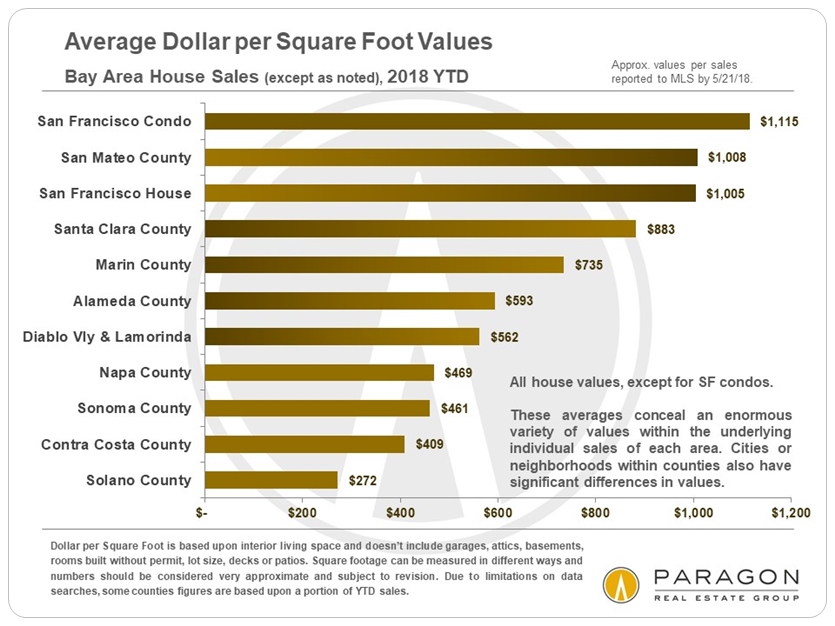
Bay Area Average Price per Square Foot Values
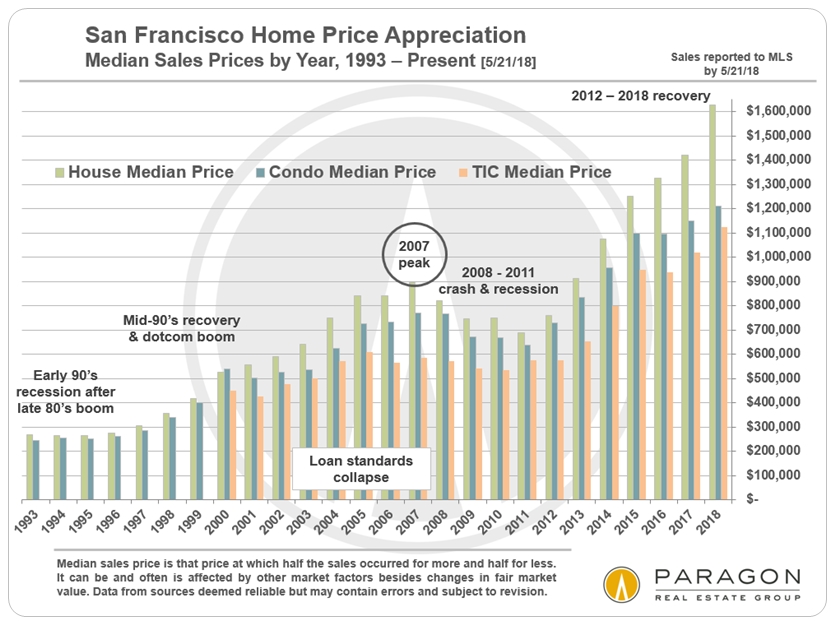
San Francisco County Median Price Trends
since 1993
Within San Francisco, appreciation rates have diverged between houses
and condos due to classic supply and demand factors.
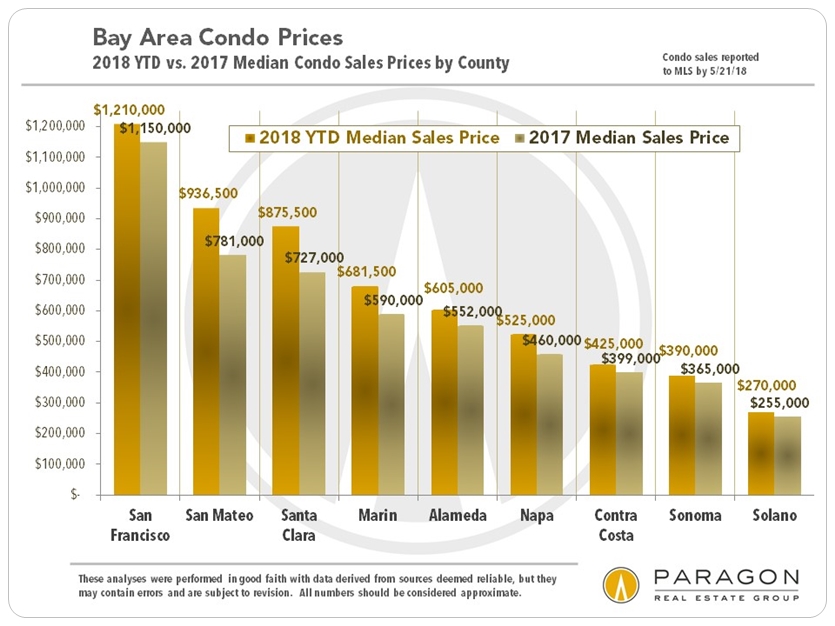
Bay Area Median Condo Prices by County
Year-over-year changes
Condos are the distinctly more affordable home purchase option, though that is less true in San Francisco than in other counties. Indeed, overall in the city, condos sell at higher price per square foot values than houses, but, of course, average condo size is much less.
The high-tech boom has led to a considerable divergence between Bay Area and national home price appreciation rates.
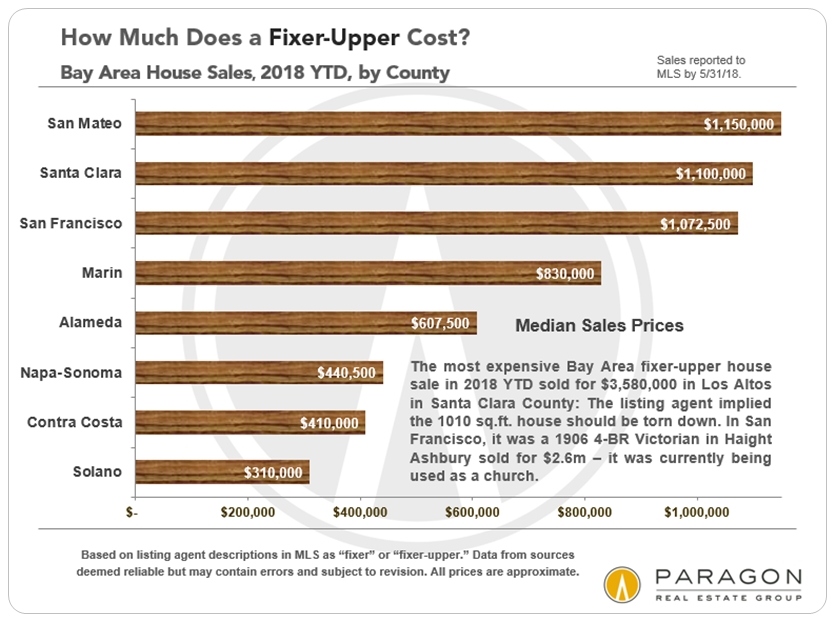
Fixer-Uppers: Median Sales Prices
------------------------------------------------------------
Bay Area Luxury Home Markets
There are very expensive neighborhoods and enclaves throughout the Bay Area, but the fabulous creation new wealth has supercharged Silicon Valley high-end real estate sales above all others.
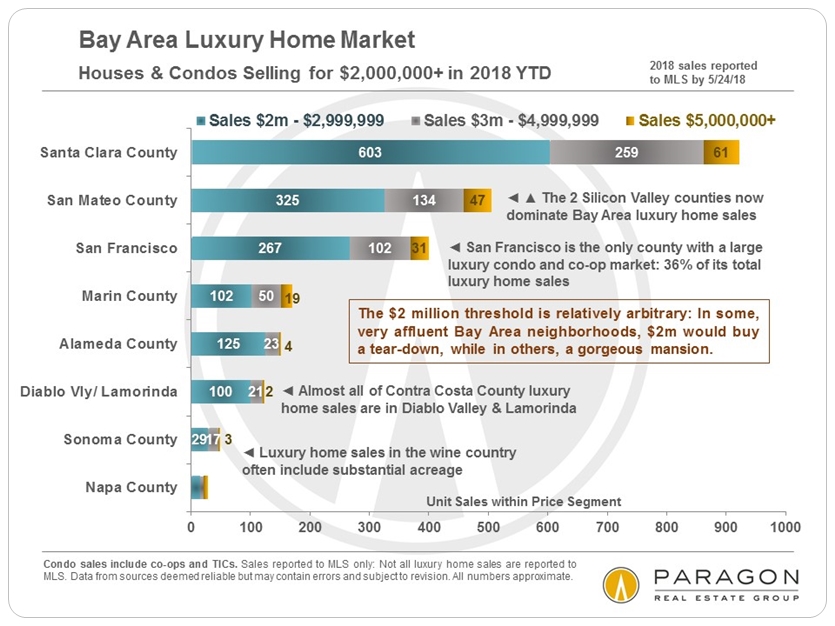
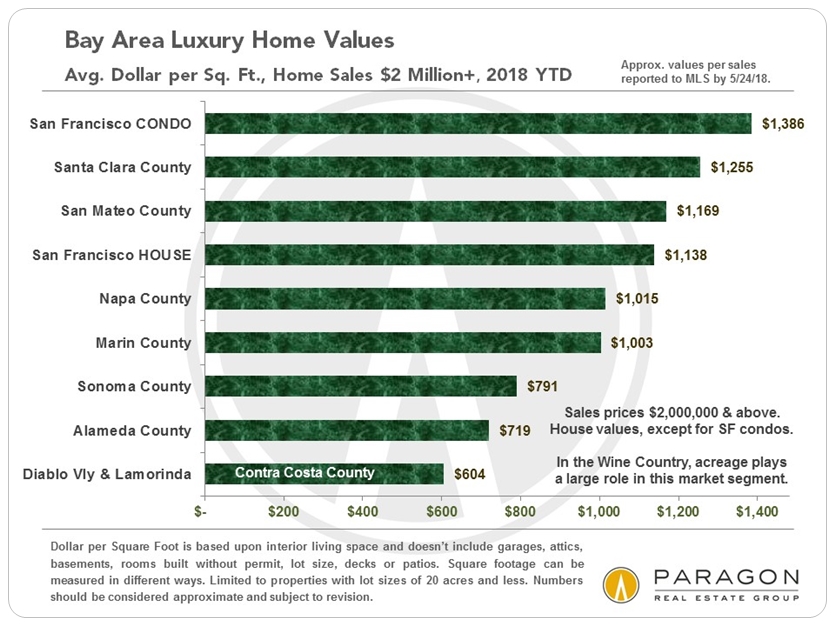
How much luxury home one gets for the money varies considerably between counties. On a dollar per square foot basis, the highest values are found in San Francisco luxury condos, often high-rise units with utterly spectacular views.
------------------------------------------------------------
Bay Area Real Estate Market Dynamics
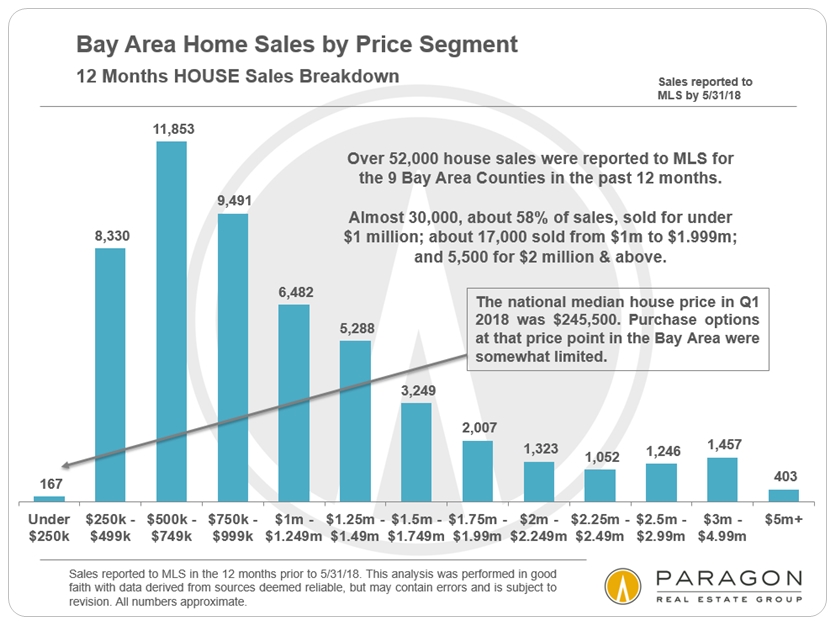
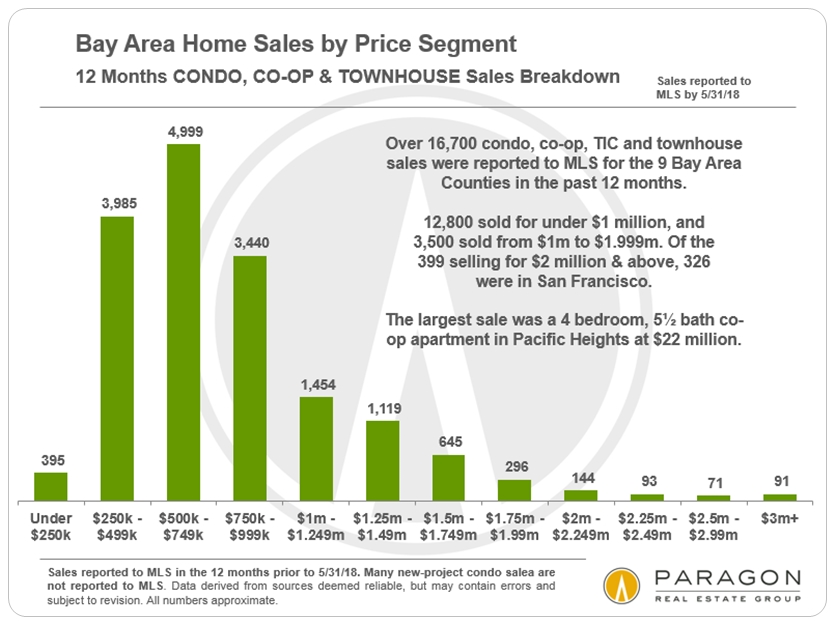
Sales by Price Segment
These next 2 charts break out house and condo sales in the 9-county Bay Area by price segment. (We roughly estimate another 10 to 12% of such home sales were not reported to MLS, and not included below.)
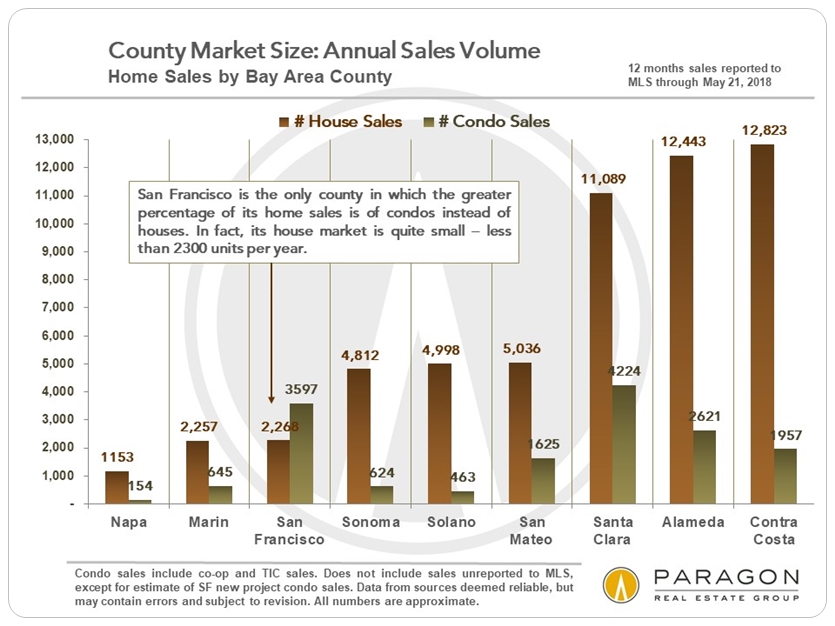
Respective Market Sizes
By unit sales volume, the Bay Area is utterly dominated
by Santa Clara, Alameda & Contra Costa Counties.
San Francisco & San Mateo close the gap in dollar
volume sales due to their high home prices.
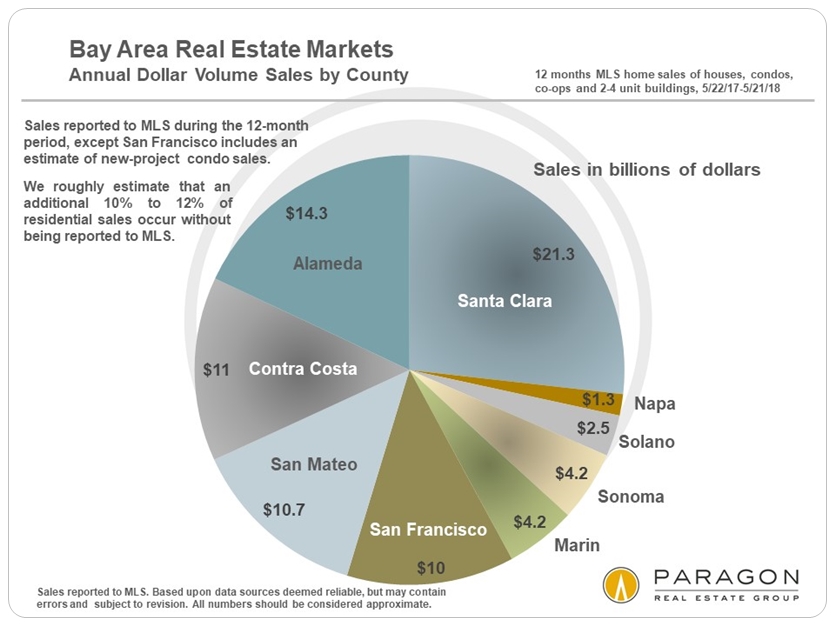
The above chart tracks dollar volume sales for houses, duets, condos, co-ops, TICs and 2-4 unit residential buildings. If the sales of larger multi-unit residential buildings and commercial buildings were included, sales volumes would soar for some counties. For example, in San Francisco, 74% of all transfer taxes collected in 2017 related to property sales of $10m+, the vast majority of which were larger apartment buildings and commercial properties.
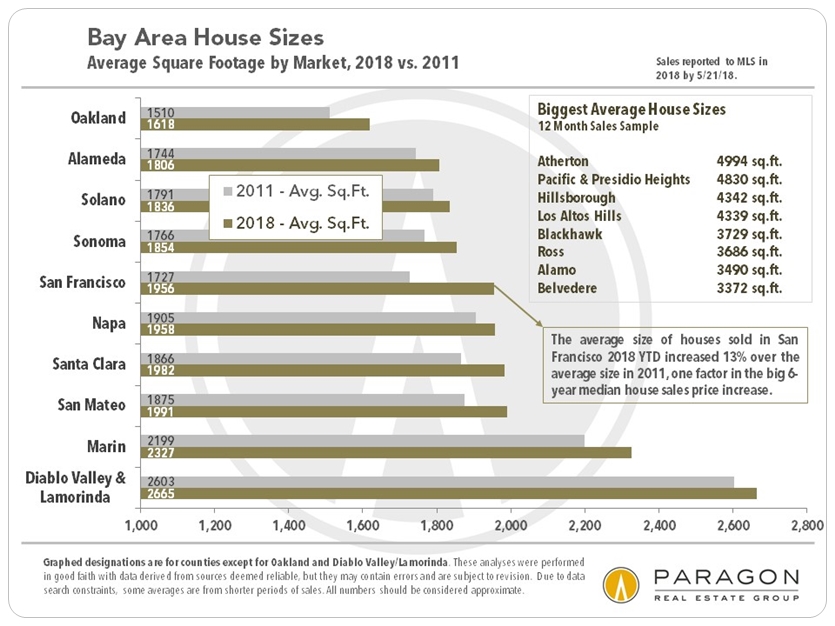
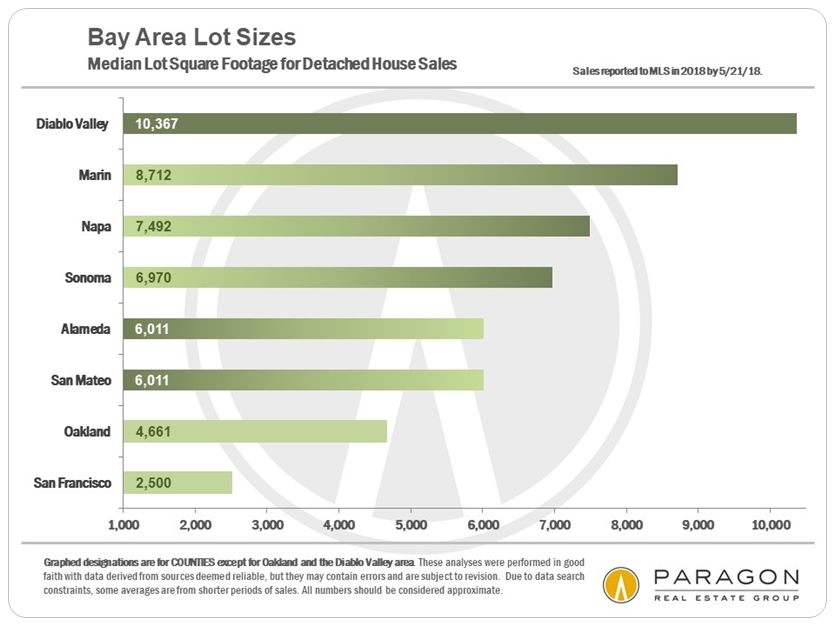
Home and Lot Sizes
As the economy recovered from the recession, people began to buy larger houses, which is one factor in increasing median home sales prices. The average size of houses sold in San Francisco increased 13% over the period, but is still far below those in Marin, and in Diablo Valley & Lamorinda in Central Contra Costa County.
Marin & Diablo Valley also have the largest median lot sizes.
Homeownership & Tenant-Occupancy Percentages
Of the 9 Bay Area counties, only San Francisco has a higher percentage of renters than of homeowners (though certain cities of other counties do as well).
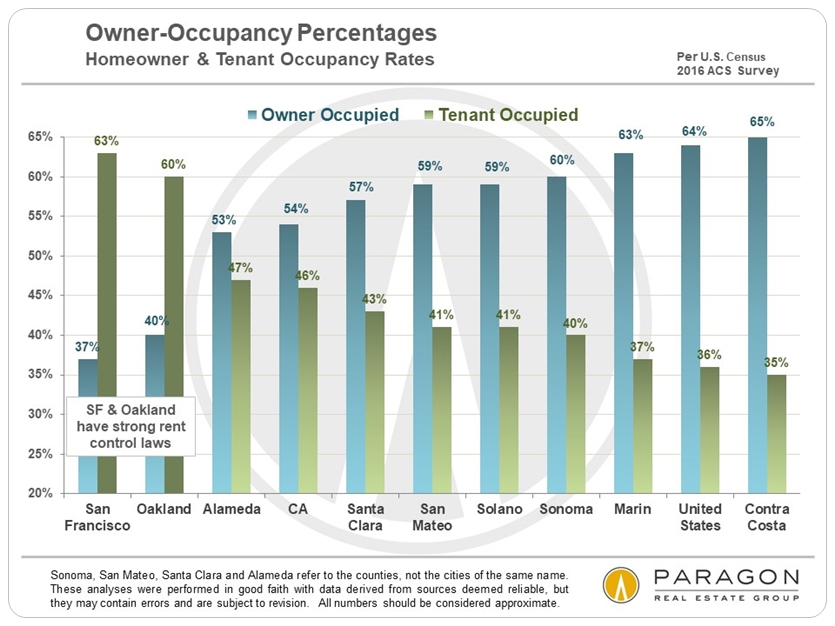
On the issue of rent and eviction controls, people have a tendency to vote their own financial interests (and not according to their opinions on macro-economic housing-supply theory): Tenants for controls, and landlords and homeowners (potential landlords) generally against them. This is why strong rent control measures are typically found only in CA cities with majority tenant populations, such as San Francisco, Oakland, Berkeley and Santa Monica. Upwardly spiraling rents, as illustrated in the below chart, has made this one of the most intense political issues of the day, to be voted on at the ballot in November.
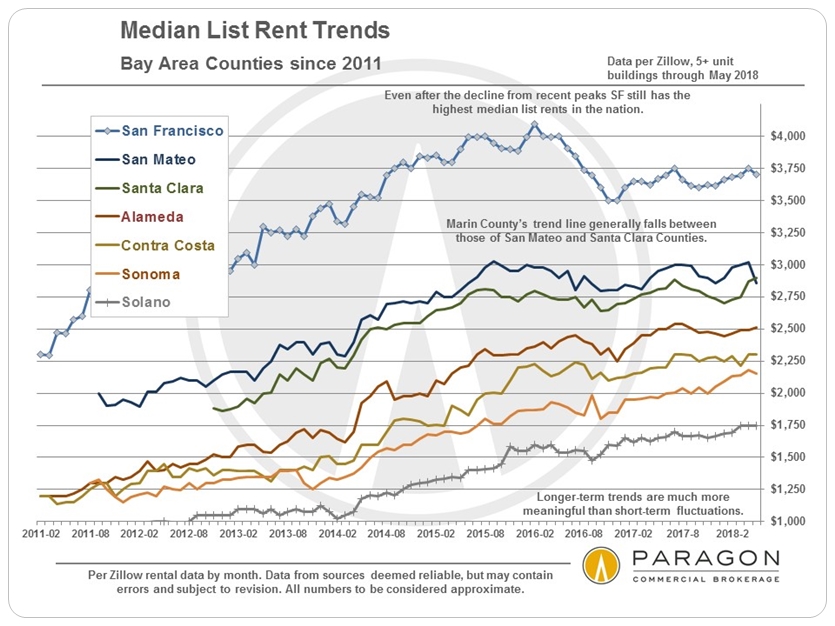
Bay Area Rent Trends
The Bay Area has the highest rents of any metro area in the nation.
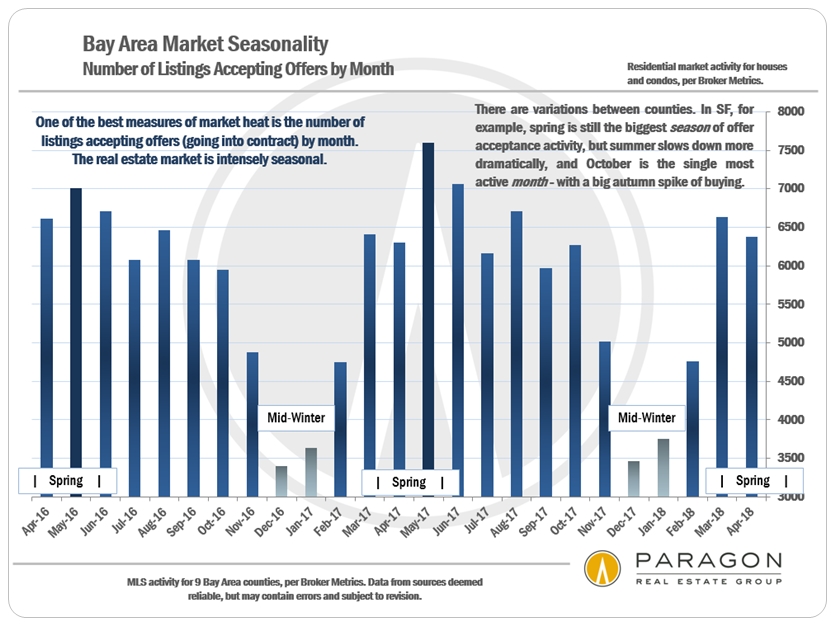
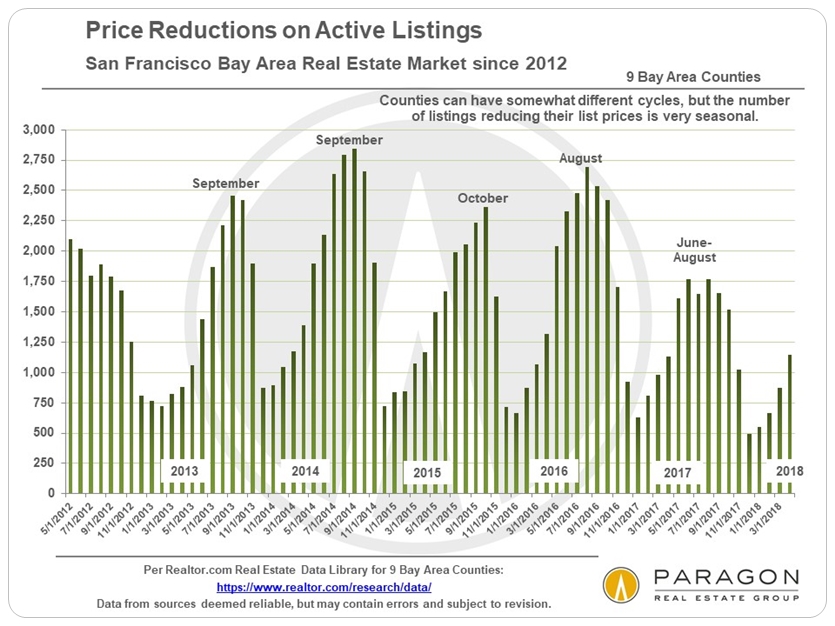
Supply, Demand & Market Seasonality
Most Bay Area markets will now start to transition from the more heated spring sales season to the less active summer season. Part of this dynamic is a marked increase in price reductions. Seasonal trends do vary by county: Sonoma, for example, has a strong second-home market which can peak in mid-summer. San Francisco and Marin typically see dramatic spikes in sales during the short autumn selling season. All markets head into big slowdowns for the mid-winter holidays, before waking up and beginning the cycle again in the new year.

Price Reductions
As the spring market ends, the major period
for listings reducing their asking prices begins.
------------------------------------------------------------
Bay Area Population & Housing Statistics
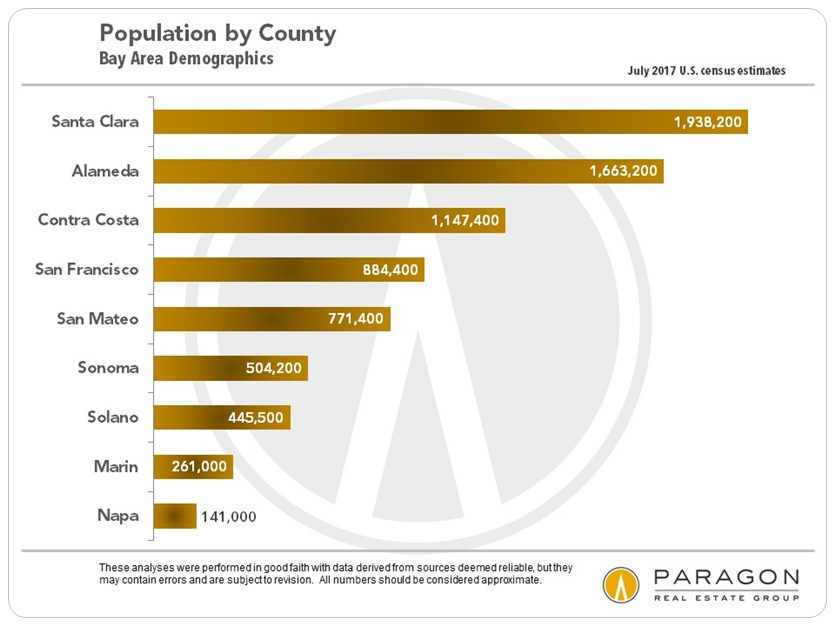
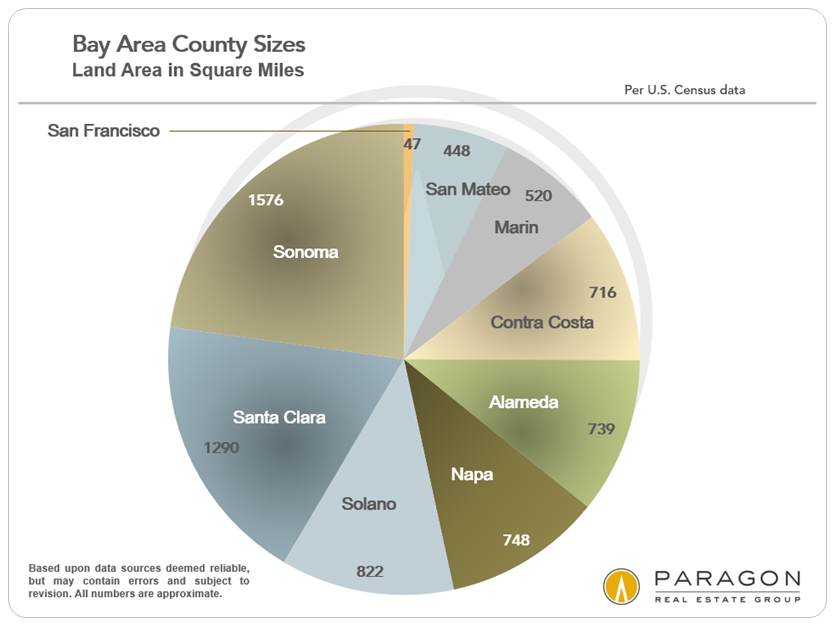
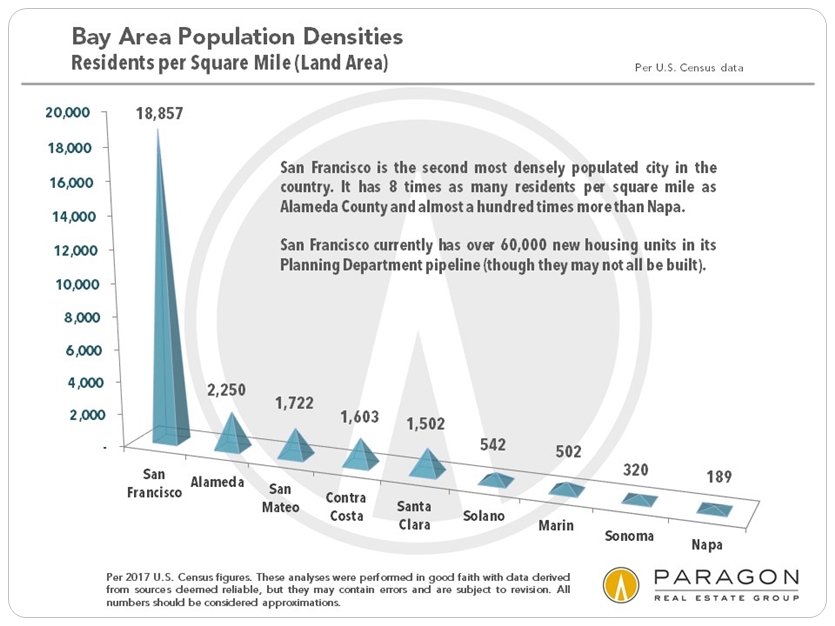
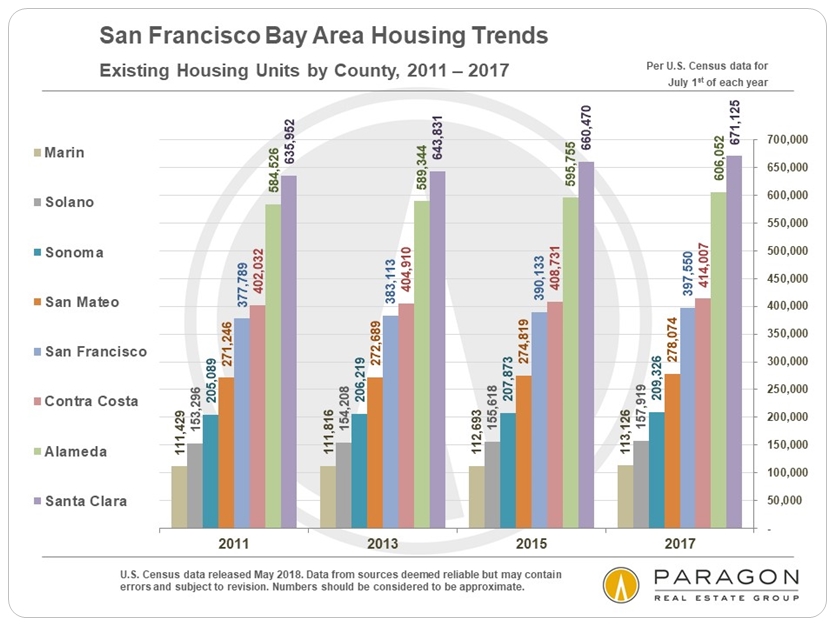
Bay Area Housing Statistics
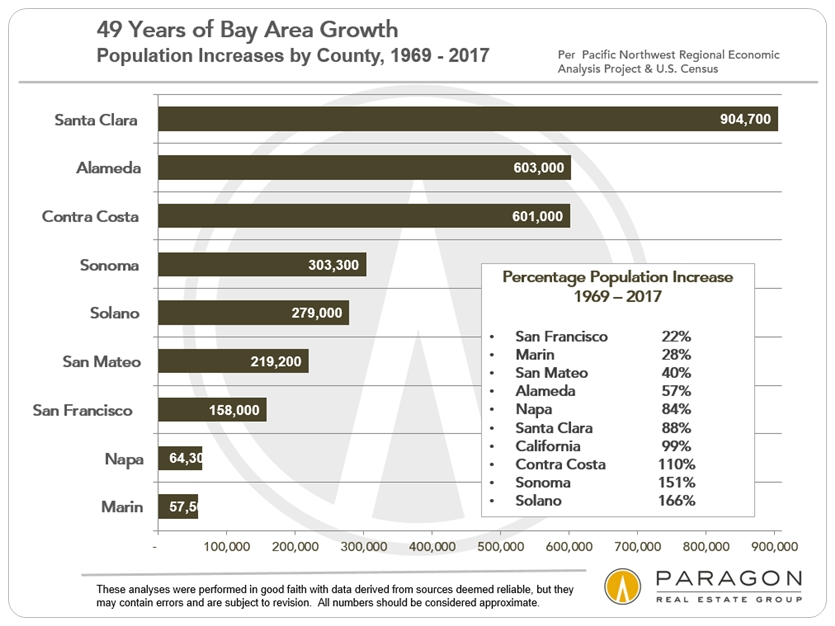
In recent years, some counties have embraced growth in housing supply, and others have resisted it. For better or worse, no county has resisted growth more than Marin. Any way you slice it, housing supply has not come close to keeping pace with the surge in population, a major factor in our real estate markets.
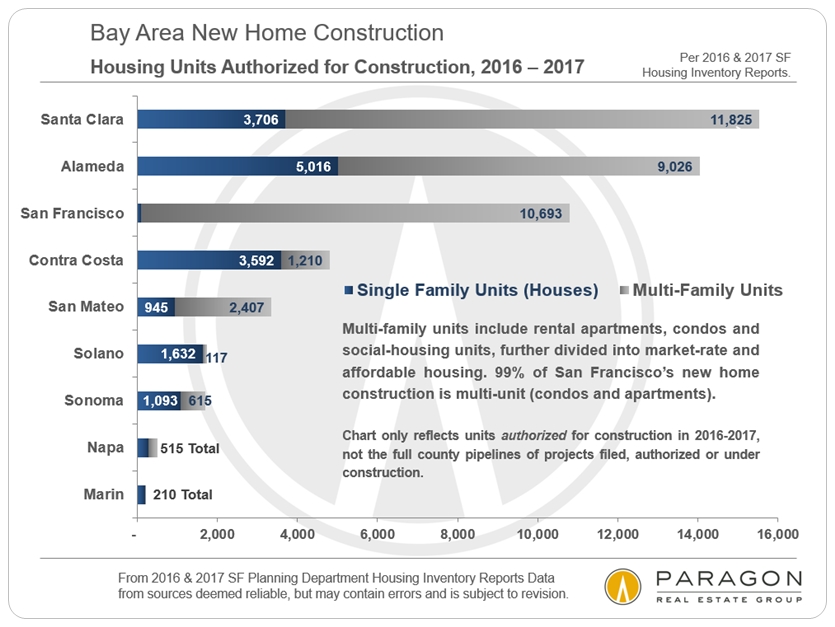
According to a recent report by Turner & Townsend, San Francisco has the second highest construction costs in the world, behind only New York, and these costs continue to accelerate due to a number of factors: land and labor costs; the long planning, approval & permitting process; political opposition to growth; and affordable housing requirements.
------------------------------------------------------------
Income, Poverty & Housing Affordability
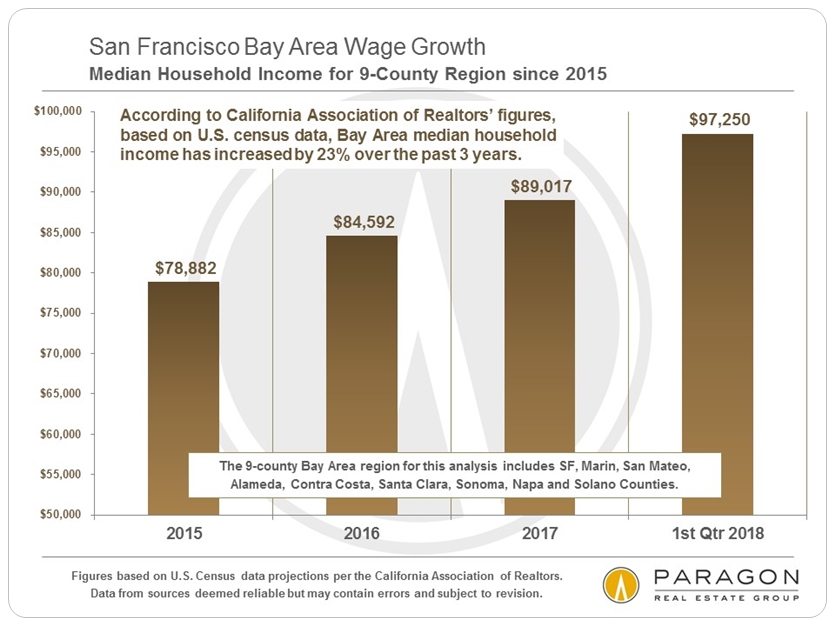
According to the above calculations by the CA Association of Realtors, Bay Area median household income has increased by 23% since 2015, as compared to a 7% national increase (as calculated by Seeking Alpha). Among other factors, it has been reported that people moving into the Bay Area earn considerably more than those moving out.

The Bay Area high-tech boom has been one of the greatest new-wealth-creation machines in history, but many residents have not shared in its benefits, or, indeed, been negatively affected by its impact on housing costs. The Bay Area ranks third for its number of billionaires (after NYC and Hong Kong, according to Wealth-X), but, on the other hand, over a million local residents live in poverty (according to the Public Policy Institute of California). We have one of the great luxury home markets in the country, and one of the worst problems with homelessness.
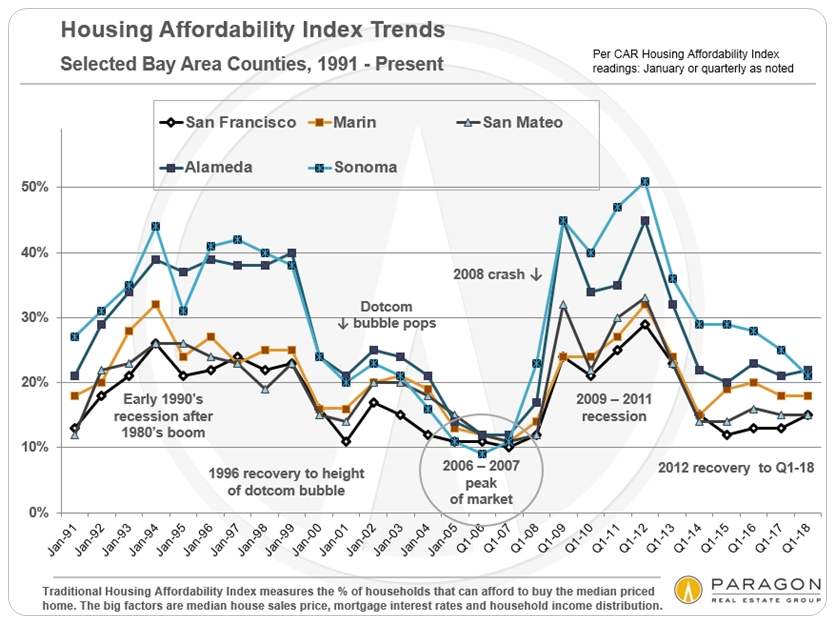
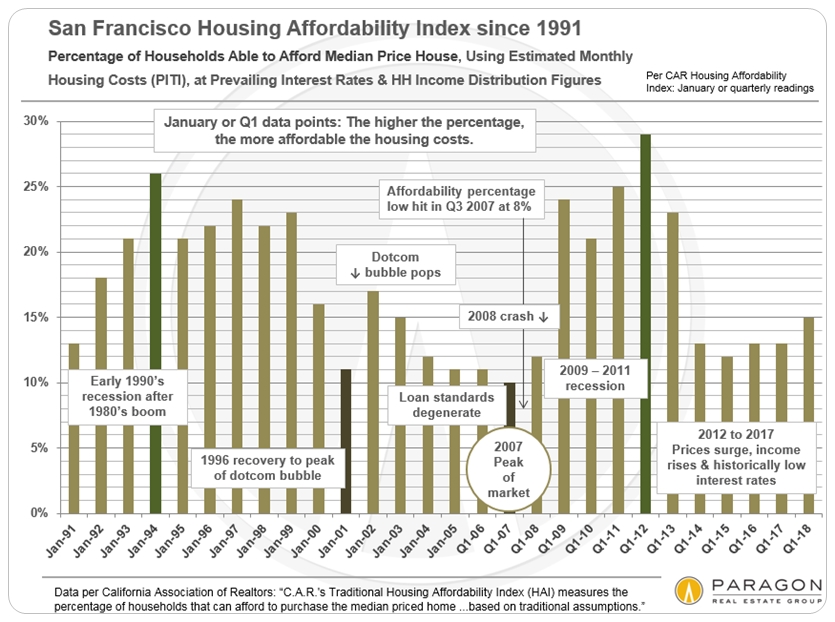
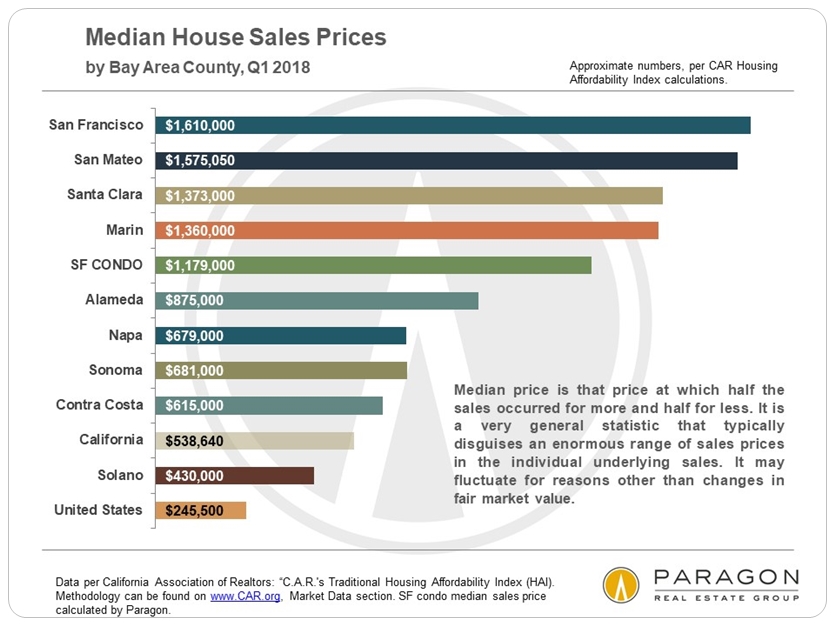
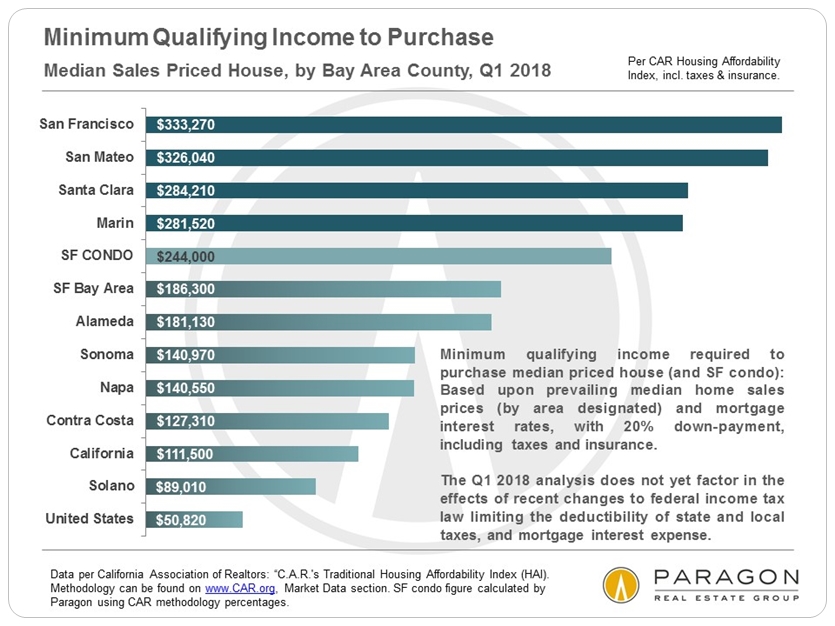
Q1 2018 Housing Affordability Statistics
per the California Association of Realtors (CAR)
According to CAR, despite very significant increases in median home prices and interest rates, affordability rates ticked up a little year-over-year in most Bay Area counties due to increases in household incomes. This surprises us, but we have not been able to review all the underlying data employed in the CAR Index. CAR has not yet been able to incorporate the recent federal tax law changes into their calculations, which would presumably lower affordability rates due to new limits on the deductibility of state and local taxes (such as property taxes) and mortgage interest costs. Depending on specific financial circumstances, our, admittedly unqualified, back-of-the-envelope estimate is that this will probably mean the loss of tens of thousands of dollars in federal income tax deductions for someone, say, owning a San Francisco house at the current median sales price. (Get more qualified counsel from your accountant.)
According to National Association of Realtors calculations, the San Jose and San Francisco metro areas are the least affordable in the country, just a bit below Honolulu.
------------------------------------------------------------
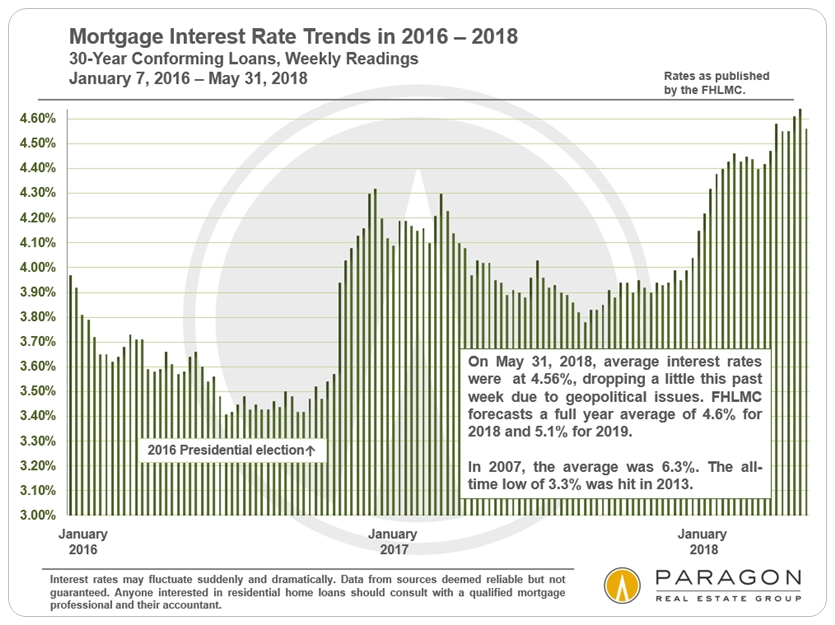
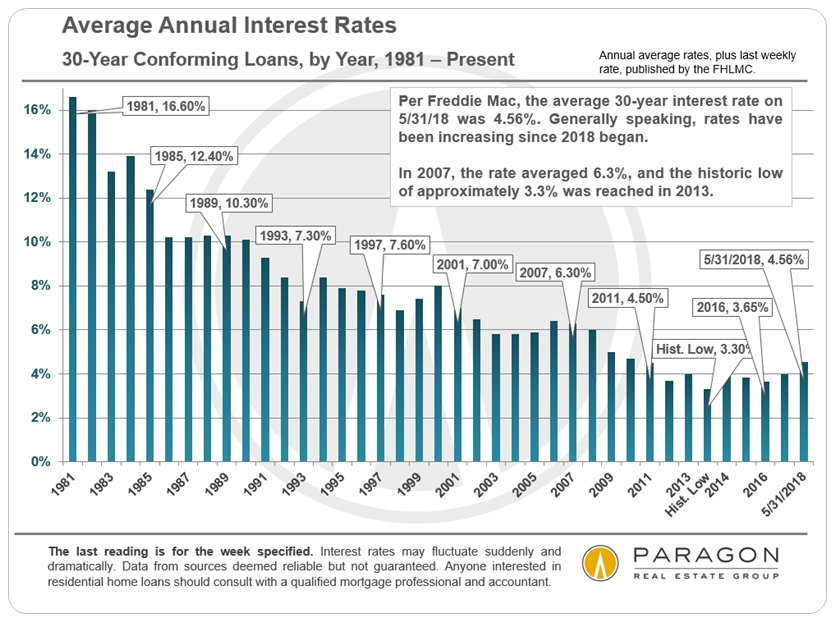
Mortgage Interest Rate Trends
Interest rates play a large role in ongoing housing costs (for those who do not pay all cash). They have risen appreciably in 2018, but so far that only seems to be motivating buyers to act more quickly before rates go higher. Still, at some point, if rates continue to rise, presumably there would be some negative impact on the market. Though considerably above the historic lows of recent years, rates are still very low by long-term standards.
------------------------------------------------------------
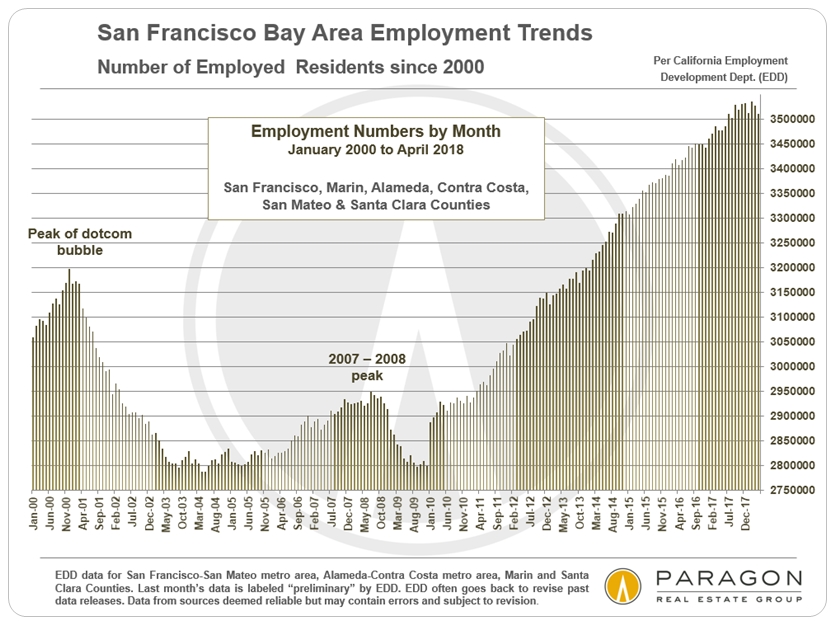
Bay Area Employment Trends
One of the foundation stones of the current Bay Area economy and housing market has been the spectacular increase in employment over the last 7 years, often in extremely compensated jobs: It recently came out that the median salary at Facebook was $240,000. (On the other hand, Mark Zuckerberg made a salary of just one dollar in 2017: Hopefully, he has other sources of income.)
As with all economic trends, employment numbers can also decline suddenly and precipitately, as occurred after the dotcom bubble burst. Note: We are not making comparisons between the two high-tech booms.