San Francisco Real Estate Market - May 2018
The Hottest Neighborhood Real Estate
Markets in San Francisco
Markets in San Francisco
All parts of the city have experienced staggering rates of
appreciation since 2011, but some neighborhoods stand out
(for a variety of different reasons)
2000 to present, different city districts experienced bubbles,
crashes and recoveries of vastly varying magnitudes
appreciation since 2011, but some neighborhoods stand out
(for a variety of different reasons)
2000 to present, different city districts experienced bubbles,
crashes and recoveries of vastly varying magnitudes
May 2018 Report
------------------------------------------------------------
------------------------------------------------------------
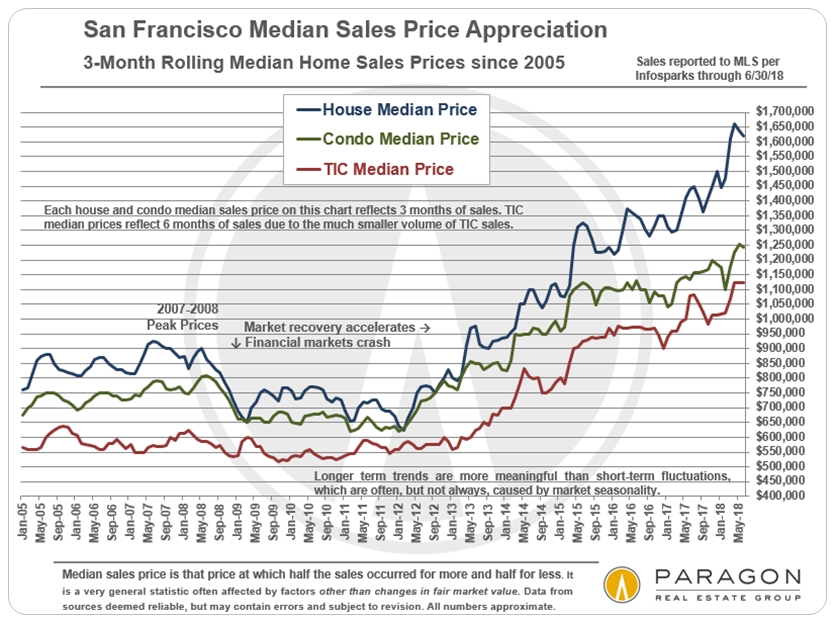
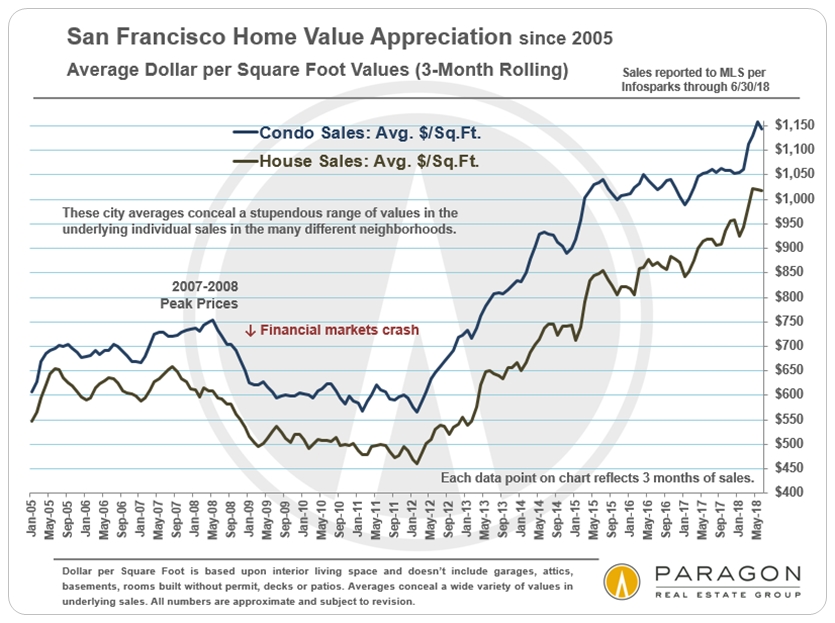
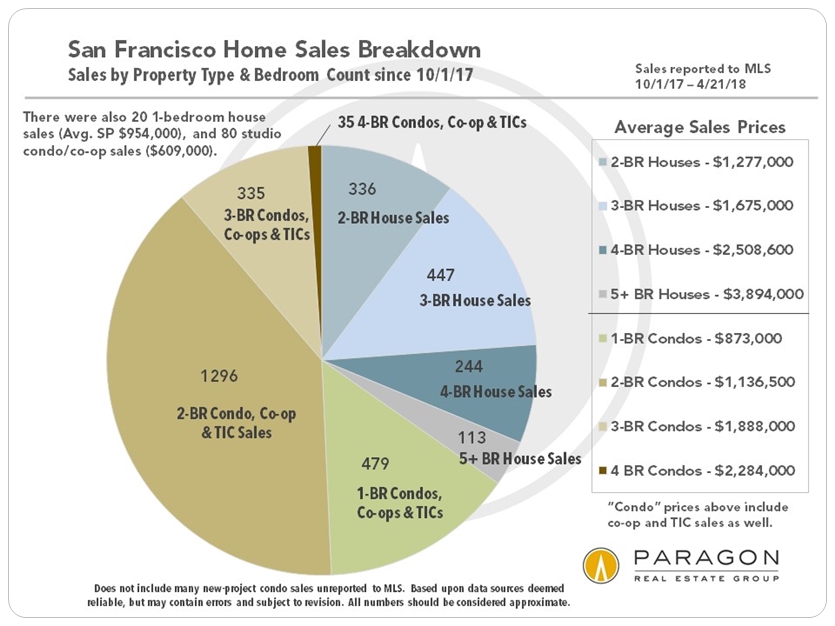
Before discussing neighborhood values, appreciation rates and market cycles, here are 3 overview charts on the entire city market.
Citywide Home Values & Trends
On a 3-month-rolling basis, median home sales prices in San Francisco yet again hit new highs in April 2018: The median house sales price jumped $55,000 over the March price to hit $1,665,000, and the median condo sales price jumped $50,000 in April to $1,225,000 (3-month rolling sales through 4/30/18, reported by May 2). Those reflect year-over-year increases of 23% and 8% respectively. Average dollar per square foot values also reached new peak values.