
San Francisco Real Estate Market - April 2018
Yet Another Dramatic Jump
in San Francisco Median House Price to over $1,600,000
Median sales price appreciation, neighborhood home price tables;
media reports of impending doom; luxury home sales; interest rates;
Bay Area rent trends; and the new home construction pipeline
April 2018 Report
------------------------------------------------------------
------------------------------------------------------------
Consumer confidence is still soaring, and buyers continue to push aside concerns about recent financial market volatility, federal tax law changes affecting Bay Area homeowners, and interest rate increases, to fuel heated neighborhood markets throughout San Francisco.
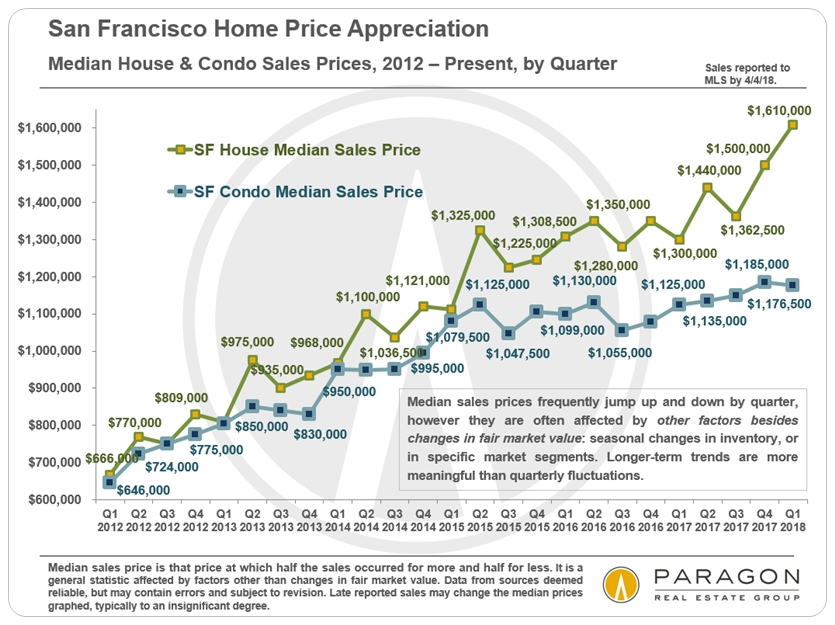
Houses have become the scarce commodity in San Francisco: Few new houses are built in the city anymore, and house owners are selling less frequently than ever. In Q1 2018, the San Francisco median house sales price soared almost 24% above the Q1 2017 price of $1,300,000, and over $100,000 above the recent peak in Q4 2017. Neighborhoods with house prices under $1.5m to $2m are, in particular, experiencing frenzied buyer demand. Median condo sales prices also continue to increase on a year over year basis, but at slower rates due to the significant quantities of new-construction condos coming on market.
Median Sales Price Changes by Quarter
since 2012
Median sales prices often fluctuate by quarter or season.
Longer-term trends are more meaningful than short-term changes.
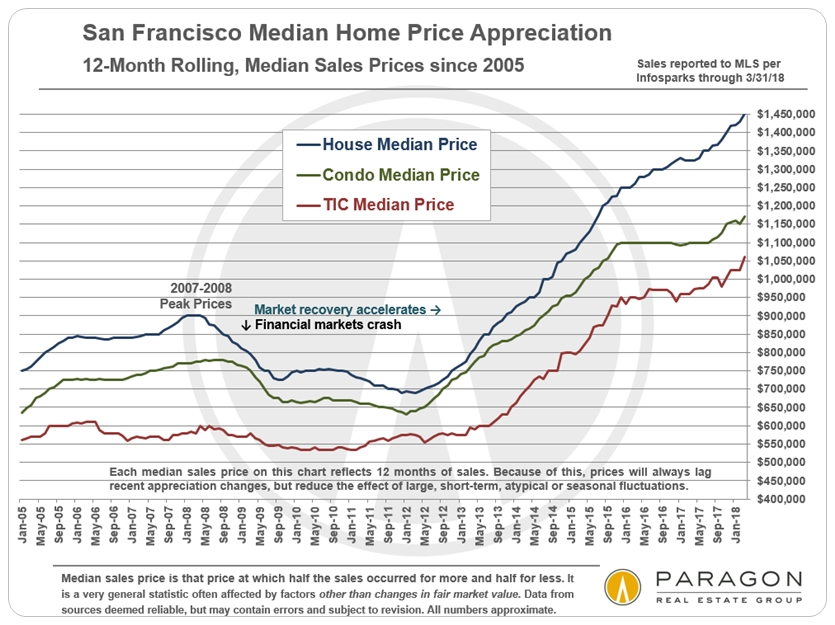
Longer-Term Median Sales Price Changes
since 2005, 12-Month Rolling Figures
12-month-rolling median sales price figures will always be behind the curve during periods of rapid appreciation, but are excellent for illustrating long-term trends, as they reduce the effects of large, anomalous or seasonal fluctuations.
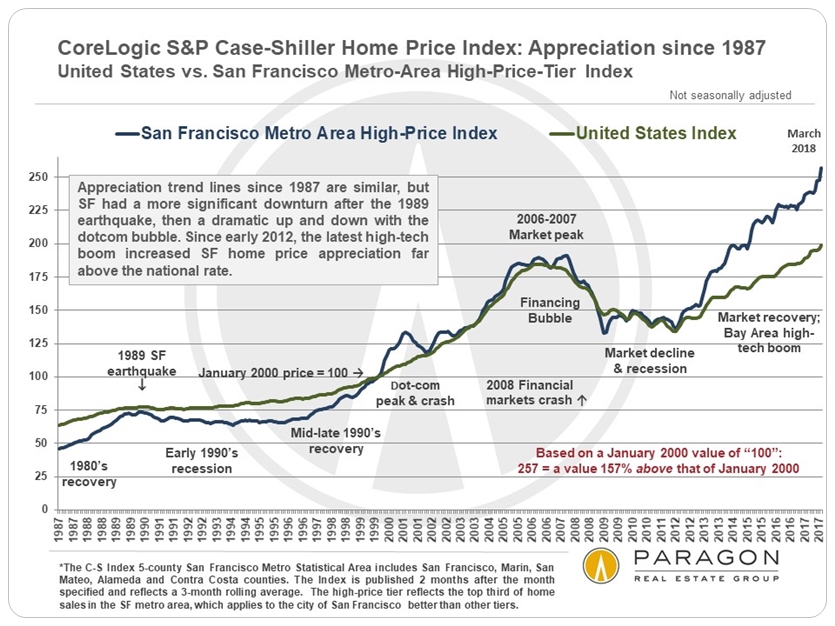
Long-Term Home Price Trends
Bay Area vs. National Appreciation since 1987
per CoreLogic S&P Case-Shiller Home Price Index
The Case-Shiller Index does not use median sales prices to measure appreciation, but instead employs its own algorithm. This chart compares the national home price appreciation trend with that for high-price-tier houses in the 5-county San Francisco Metro Area. The high price tier applies best to most of the markets in San Francisco, Central-Southern Marin, San Mateo, and Diablo Valley & Lamorinda.
In this chart, home prices in January 2000 are designated at a value of 100, thus the reading of 248 in December 2017 signifies a price that has appreciated 148% in the 18 years since then. Notice how similar the national and Bay Area trend lines are, with appreciable variations occurring after the 1989 earthquake, during the dotcom bubble and crash, and during the most recent Bay Area high tech boom.
As always, market dynamics often vary significantly by specific location, property type and price segment, and median prices are often affected by other factors besides changes in fair market value (such as fluctuations in luxury home and new construction sales, and in the average size of homes sold). Late reported sales may affect the median sales prices illustrated in the quarterly chart, though typically only to a minor degree.
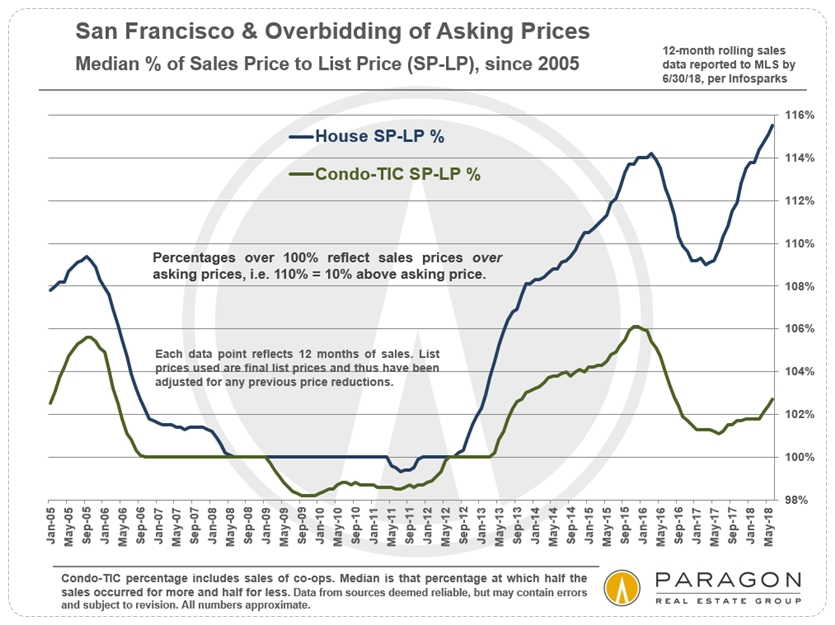
Overbidding Asking Prices in San Francisco
Sales Price to List Price % by Property Type, 12-Month Rolling Figures
Overbidding reflects buyer competition for new listings. It is a pure supply and demand issue, and this chart illustrates the respective heat of property-type markets in the city. However it should be noted that some agents have adopted a strategy of underpricing their listings, which will artificially increase overbidding percentages.
------------------------------------------------------------
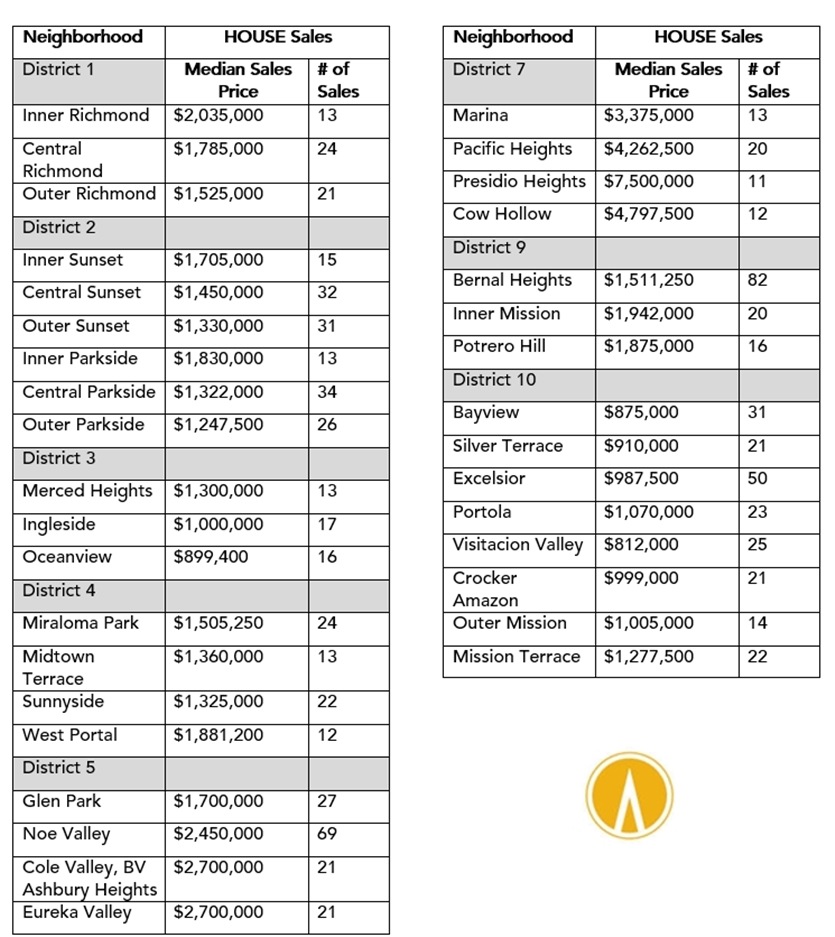
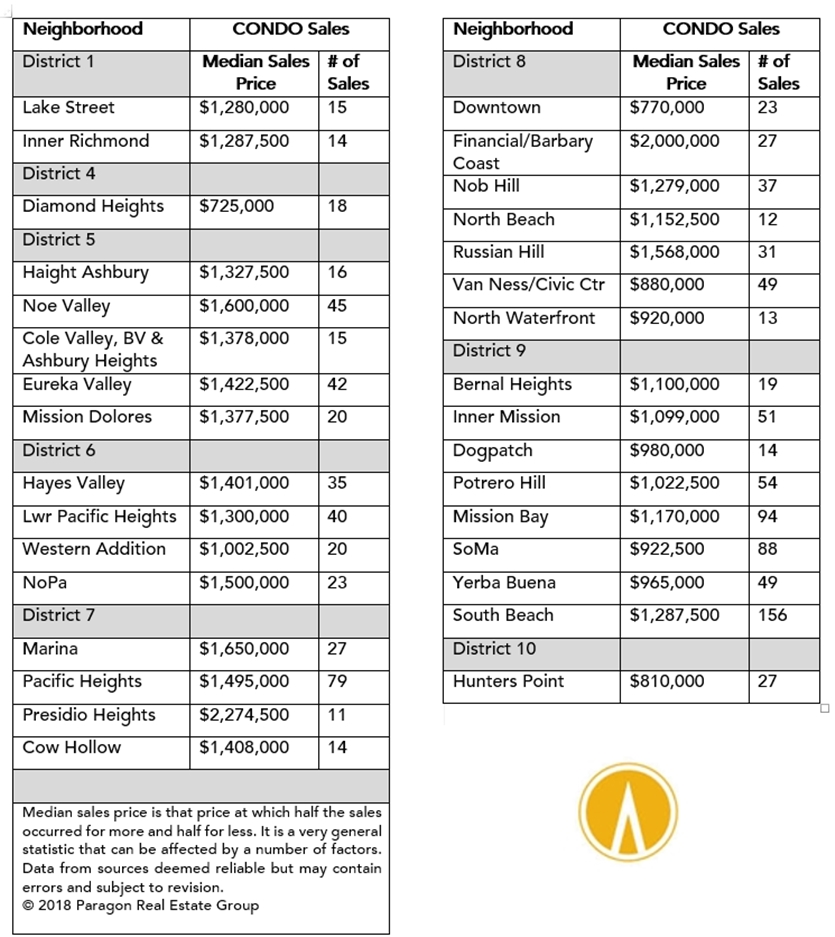
San Francisco Median Sales Prices by Neighborhood
Reflecting Sales Reported to MLS 10/1/17 – 4/5/18
Neighborhoods with a Minimum of 12 Sales in Period
(except Presidio Heights)
Below is a glance at recent house and condo median sales prices broken out by neighborhood for sales reported to MLS in the last 6 months or so - basically since autumn sales began to close. There are many San Francisco neighborhoods that did not have at least 12 sales during the period and these were not included, because the fewer the sales, the less reliable the statistical analysis. The only exception was Presidio Heights: It holds the title for both highest house and condo median sales prices, so we included it even though it had only 11 sales of each property type.
Note: In recent years, the Pacific Heights median house sales price has typically been running close to $6m, far above its price in the table below. But median prices can fluctuate dramatically in the most expensive neighborhoods: This is due to the relatively small number of sales and the enormous range in individual sales prices. Absent some definitive market event, sudden, abnormal spikes up or down in neighborhood values should always be taken with a grain of salt until confirmed over the longer term.
There are 10 Realtor districts and 70-odd neighborhoods in the city, and here is a link to a detailed San Francisco Neighborhood Map.
If you would like information on a neighborhood not included here, please let us know.
------------------------------------------------------------
The Facts Regarding Bay Area
Migration, Population & Employment Trends
Alarmist Media Reports Forecast Doom for Bay Area
Many semi-hysterical articles were published in March regarding Bay Area residents fleeing in droves, that more people are leaving than arriving, that Silicon Valley is over, and this may spell disaster for the region. Wow, that sounds very bad - but is not true: Though the rate of growth has considerably slowed from the torrid pace of recent years - which is probably a good thing, since the Bay Area is now bursting at the seams - more people are still arriving than leaving, and population and employment numbers are still increasing.
Here are 3 of the charts from our full article, based on recent U.S. census and CA state employment data.
Net domestic and foreign migration in and out of the San Francisco Metro Area,
natural population increases and annual net population growth
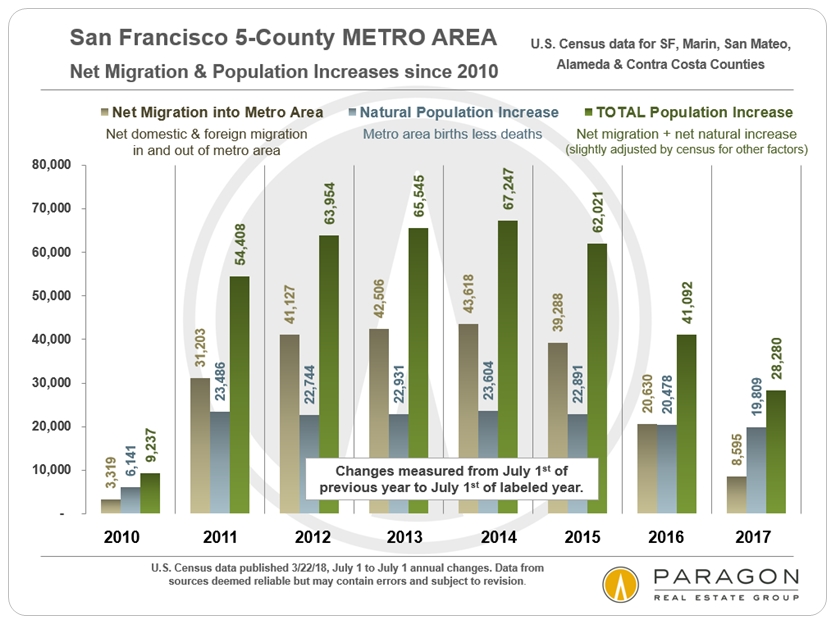
San Francisco & Bay Area populations continued to increase in 2017,
though slowing from the feverish growth rates of previous years.

The Bay Area continues to be a high-paying-job-creating machine,
though hiring intermittently speeds up or slows down.

San Francisco Luxury Home Sales Trends
since 2005
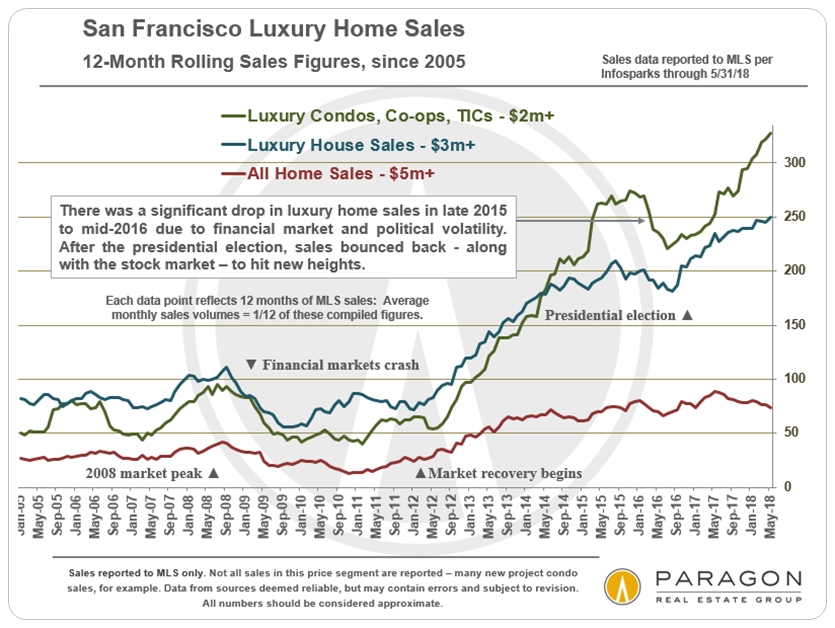
More analyses: Paragon Luxury Market Report
------------------------------------------------------------
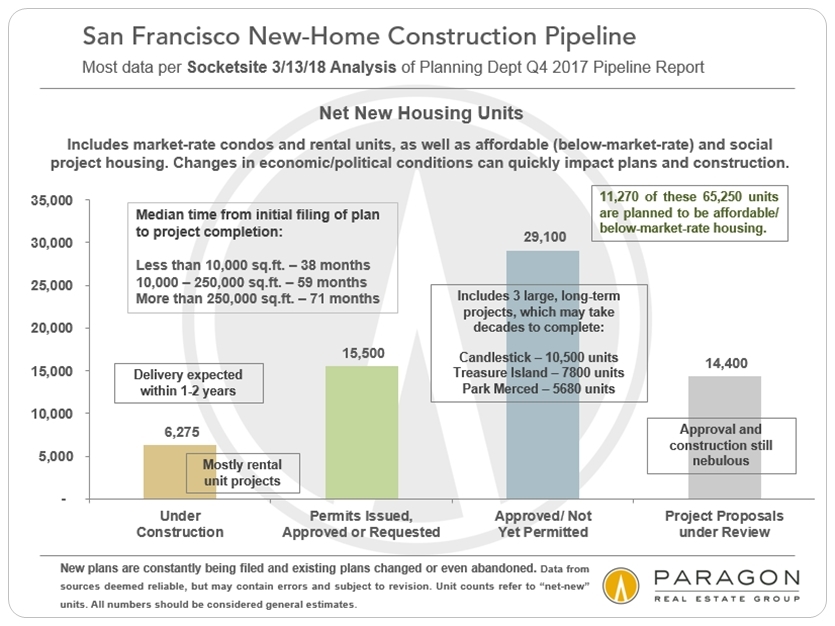
San Francisco New Housing Construction Pipeline
There are approximately 65,000 housing units in the San Francisco Planning Department pipeline, which includes condos, apartments, and affordable and social project housing in various states of plan submittal, review, approval, permit issuance and construction. The construction of new rental units continues to outpace new-condo construction in San Francisco, an interesting shift which just began a couple years ago. More projects continue to enter the pipeline, but some of the really big projects, such as Treasure Island and Candlestick, do not seem to be making much headway toward breaking ground.
------------------------------------------------------------
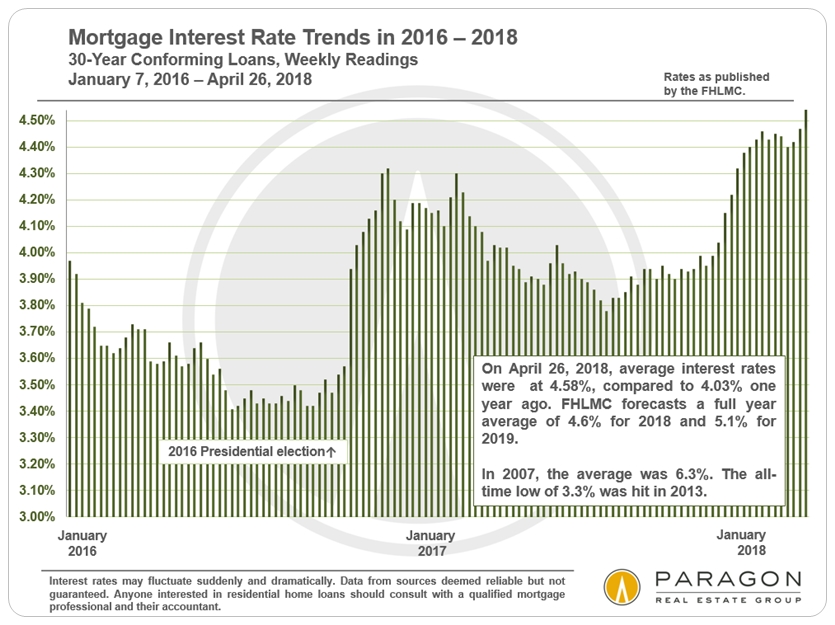
Mortgage Interest Rates
Interest rate changes are one of many factors we reviewed in a recent report Positive & Negative Factors in Bay Area Markets. It may be that fears of impending rate increases are helping to fuel the strong buyer demand we are seeing so far in 2018.
------------------------------------------------------------
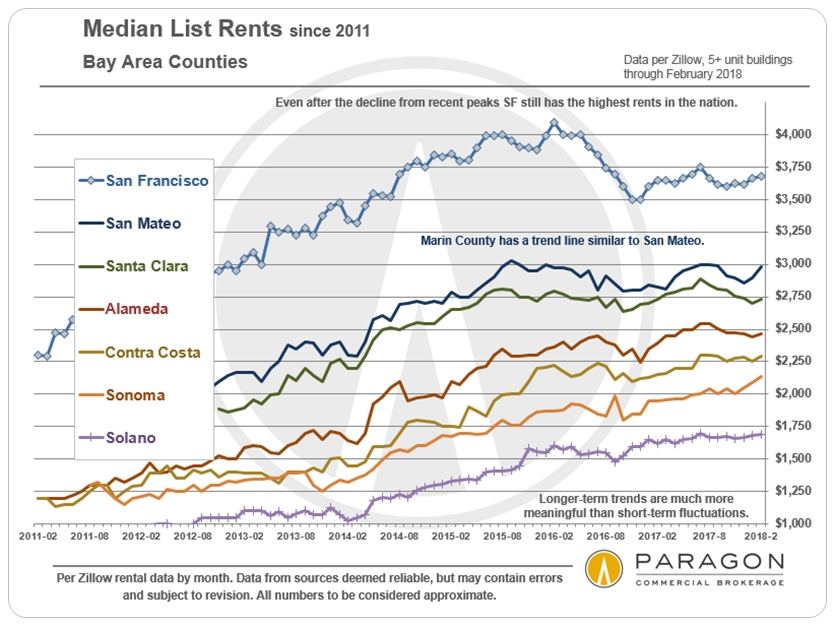
MEDIAN List Rents by County
Short-Term Trends since 2011
Houses have become the scarce commodity in San Francisco: Few new houses are built in the city anymore, and house owners are selling less frequently than ever. In Q1 2018, the San Francisco median house sales price soared almost 24% above the Q1 2017 price of $1,300,000, and over $100,000 above the recent peak in Q4 2017. Neighborhoods with house prices under $1.5m to $2m are, in particular, experiencing frenzied buyer demand. Median condo sales prices also continue to increase on a year over year basis, but at slower rates due to the significant quantities of new-construction condos coming on market.
since 2012
Median sales prices often fluctuate by quarter or season.
Longer-term trends are more meaningful than short-term changes.
Longer-Term Median Sales Price Changes
since 2005, 12-Month Rolling Figures
Long-Term Home Price Trends
Bay Area vs. National Appreciation since 1987
per CoreLogic S&P Case-Shiller Home Price Index
In this chart, home prices in January 2000 are designated at a value of 100, thus the reading of 248 in December 2017 signifies a price that has appreciated 148% in the 18 years since then. Notice how similar the national and Bay Area trend lines are, with appreciable variations occurring after the 1989 earthquake, during the dotcom bubble and crash, and during the most recent Bay Area high tech boom.
As always, market dynamics often vary significantly by specific location, property type and price segment, and median prices are often affected by other factors besides changes in fair market value (such as fluctuations in luxury home and new construction sales, and in the average size of homes sold). Late reported sales may affect the median sales prices illustrated in the quarterly chart, though typically only to a minor degree.
Overbidding Asking Prices in San Francisco
Sales Price to List Price % by Property Type, 12-Month Rolling Figures
Overbidding reflects buyer competition for new listings. It is a pure supply and demand issue, and this chart illustrates the respective heat of property-type markets in the city. However it should be noted that some agents have adopted a strategy of underpricing their listings, which will artificially increase overbidding percentages.
------------------------------------------------------------
San Francisco Median Sales Prices by Neighborhood
Reflecting Sales Reported to MLS 10/1/17 – 4/5/18
Neighborhoods with a Minimum of 12 Sales in Period
(except Presidio Heights)
Note: In recent years, the Pacific Heights median house sales price has typically been running close to $6m, far above its price in the table below. But median prices can fluctuate dramatically in the most expensive neighborhoods: This is due to the relatively small number of sales and the enormous range in individual sales prices. Absent some definitive market event, sudden, abnormal spikes up or down in neighborhood values should always be taken with a grain of salt until confirmed over the longer term.
There are 10 Realtor districts and 70-odd neighborhoods in the city, and here is a link to a detailed San Francisco Neighborhood Map.
If you would like information on a neighborhood not included here, please let us know.
------------------------------------------------------------
The Facts Regarding Bay Area
Migration, Population & Employment Trends
Alarmist Media Reports Forecast Doom for Bay Area
Here are 3 of the charts from our full article, based on recent U.S. census and CA state employment data.
natural population increases and annual net population growth
San Francisco & Bay Area populations continued to increase in 2017,
though slowing from the feverish growth rates of previous years.
The Bay Area continues to be a high-paying-job-creating machine,
though hiring intermittently speeds up or slows down.
since 2005
More analyses: Paragon Luxury Market Report
------------------------------------------------------------
San Francisco New Housing Construction Pipeline
There are approximately 65,000 housing units in the San Francisco Planning Department pipeline, which includes condos, apartments, and affordable and social project housing in various states of plan submittal, review, approval, permit issuance and construction. The construction of new rental units continues to outpace new-condo construction in San Francisco, an interesting shift which just began a couple years ago. More projects continue to enter the pipeline, but some of the really big projects, such as Treasure Island and Candlestick, do not seem to be making much headway toward breaking ground.
------------------------------------------------------------
Mortgage Interest Rates
------------------------------------------------------------
MEDIAN List Rents by County
Short-Term Trends since 2011